Journey of Performance tuning our Java API's
Apr. 4, 2023We have recently ported all our application from our own cloud solution to AWS public cloud and switching out all our services to depend on AWS specific services like Dynamodb and Managed Airflow and Secrets manager for Storing secrets and most important of all amazon Elastic compute services to run our containerized applications. Since all of our application are run on JVM a very attractive proposition is to switch all of our application to run on amazon’s own Arm based Gravitron instances.So Lets Test the potential cost savings by running and testing those API’s in AWS gravitron instances.
Understanding the relation Between performance and resources
Before comparing and tuning the performance of our application between the x86 and ARM instances Lets see how our instance will behave under load with the default settings and explore the relation of our application with amount of CPU and RAM we allocate to run and the amount of requests it can process. Of Course in the real world this will depend on many factors and many other bottle necks, So lets fix the parameters for our testing conditions. All of our busy Rest API’s are serving transformed Manufacturing Report records yo be consumed by downstream dashboard and the API’s are deployed in same region as Redshift cluster.
Lets Assume the Redshift cluster is not the bottleneck and has sufficient capability to serve our API clients. So in our Testing environment we are going to simply have out mock api to query same query for the entire test that is first 100,000 records of one our tables. this way the db cluster has no problem of serving the request since its the same request.
Lets deploy the Contextual API in comparable instances in AWS Instances. m7g.xlarge and m5.xlarge with 4vcpus and 16GB of RAM running Amazon 2023 Linux. Both are in same Availability zone and the load is generated from Jmeter the t3.xlarge instance in same region. I have called the endpoint from curl couple of times and the Response is 100K records and the total payload is 143MB and took roughly 2 seconds. Our production performance test is conducted with 200 clients and Jmeter is calling same endpoint with 200 clients and with ramp up period of 60 seconds. Let’s start the testing.
Instantly The Both Jmeter and the API’ Blew a gasket and returned 100% error rate in the summary results. Looking into the API logs API is failing to acquire connection to SQL database but our database is a big cluster and handling 200 connections should be no big deal.
Creating summariser <summary>
Created the tree successfully using arm-test-plan.jmx
Starting standalone test @ 2023 Apr 22 19:36:38 UTC (1682192198290)
Waiting for possible Shutdown/StopTestNow/HeapDump/ThreadDump message on port 4445
Generate Summary Results +     69 in 00:00:22 =    3.1/s Avg:  3205 Min:     0 Max:  8550 Err:    69 (100.00%) Active: 74 Started: 74 Finished: 0
summary +     69 in 00:00:22 =    3.1/s Avg:  3205 Min:     0 Max:  8550 Err:    69 (100.00%) Active: 74 Started: 74 Finished: 0
2023-04-22 19:36:51,583 WARN  [org.hib.eng.jdb.spi.SqlExceptionHelper] (executor-thread-27) SQL Error: 0, SQLState: null
2023-04-22 19:36:51,587 ERROR [org.hib.eng.jdb.spi.SqlExceptionHelper] (executor-thread-27) Sorry, acquisition timeout!
2023-04-22 19:36:51,587 ERROR [io.qua.ver.htt.run.QuarkusErrorHandler] (executor-thread-27) HTTP Request to /context/alarms failed, error id: 90e2fbe7-04c0-4418-93d2-e53ceab753ef-9: javax.persistence.PersistenceException: org.hibernate.exception.GenericJDBCException: Unable to acquire JDBC Connection
	at org.hibernate.internal.ExceptionConverterImpl.convert(ExceptionConverterImpl.java:154)
    ...........
	at io.netty.util.concurrent.FastThreadLocalRunnable.run(FastThreadLocalRunnable.java:30)
	at java.base/java.lang.Thread.run(Thread.java:833)
Caused by: org.hibernate.exception.GenericJDBCException: Unable to acquire JDBC Connection
	at org.hibernate.exception.internal.StandardSQLExceptionConverter.convert(StandardSQLExceptionConverter.java:42)
	... 15 more
Caused by: java.sql.SQLException: Sorry, acquisition timeout!
	at io.agroal.pool.ConnectionPool.handlerFromSharedCache(ConnectionPool.java:294)
	... 35 more
Upon reading into the jmeters docs the rampup period is the culprit for these errors. I have misunderstood the rampup period. with these settings as jmeter is adding 200 clients in 60 seconds which is causing api to fail to acquire connections. Jmeter also reported a Out of Heap memory issue. By looking into the docs The default heap size is 1GB[1] and for the test executing that seems to be a little less so the Max heap memory is set to 8GB. Also The test case is not comparable to the production performance test as our production api is configured to return 10,000 records at a time so lets reduce the number of clients to 20 instead of 200. Lets run the test again with 10 loops. That is 200 requests in total. Lets test again
[ec2-user@ip-10-1-21-242 perftest]$ JVM_ARGS="-Xms4G -Xmx8G" ./apache-jmeter-5.5/bin/jmeter -n -t arm-test-plan.jmx
As i restarted the test here some interesting things happened. The application threw some out of memory errors but strangely the memory usage of application in htop sits below 5GB out of 16GB instance where nothing else is running. What is the problem here ? Is GC not able to keep up with the Object creation and not able to utilize all the memory.
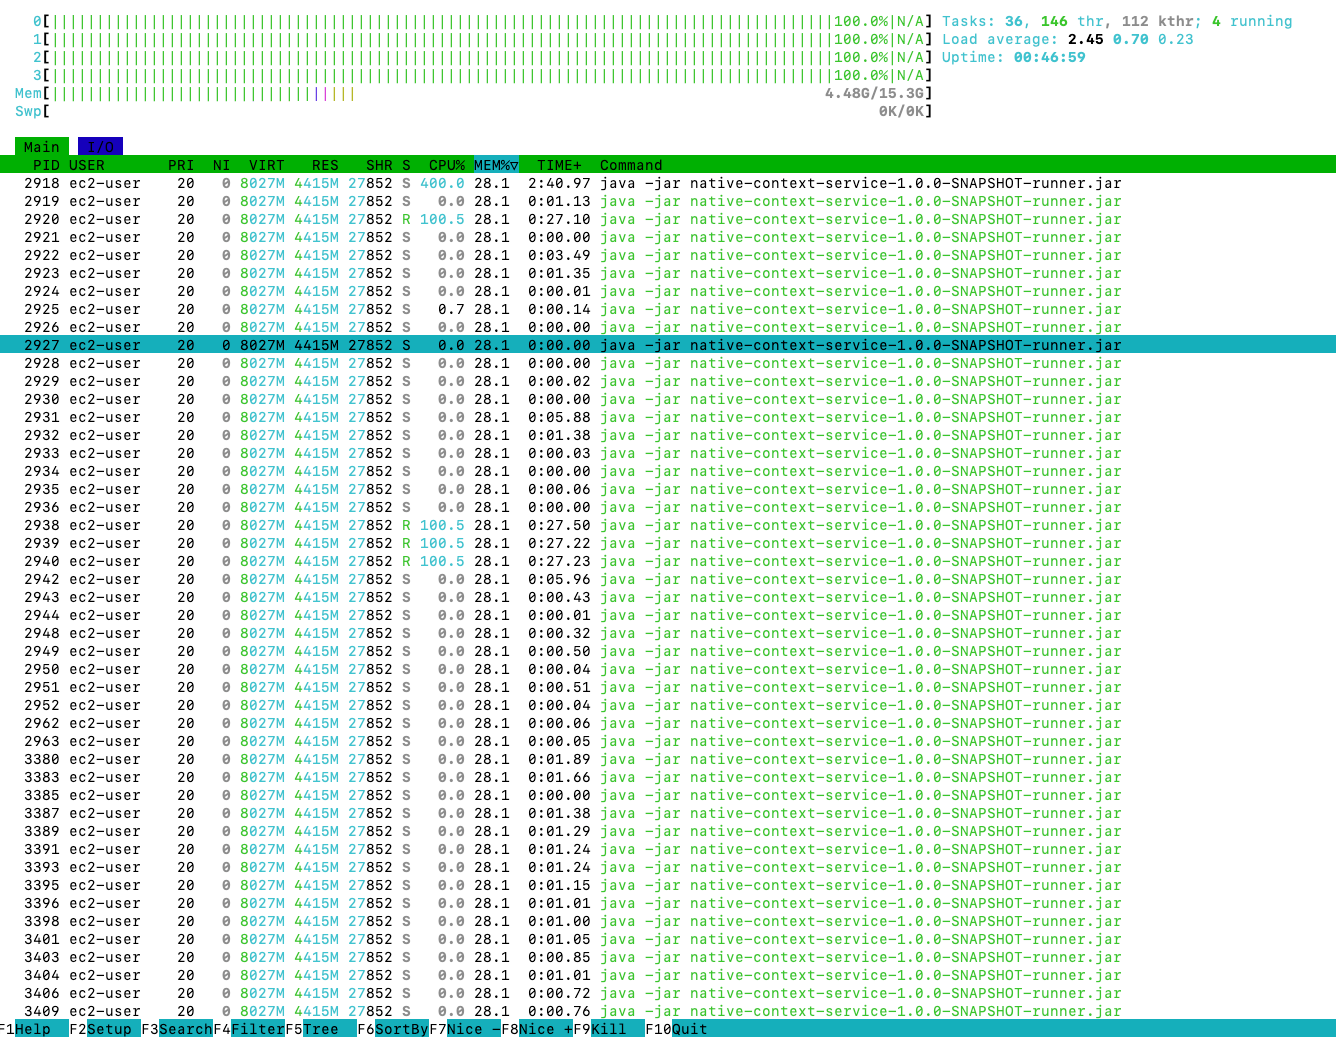
The problem turned out to be simple. The answer is in JVM ergonomics. The default max heap size is 1/4th of machine. so max heap is limited to 4GB. We can simple change this behaviour with -Xmx and -Xms JVM arguments.
This also raised some important question. As we are running in Fargate containers with default max heap size will that result in container memory being not used ? How does it affect out scaling strategy ? since the garbage collection is triggered when the threashold's of memory usage for young space and survivor space, The scaling strategy based on on memory consumption will be rendered Very inefficient. These are the Questions that need solutions.
For Now we can set he maximum heap manually to 75% of the physical memory and enable GC logs. also lets reduce out client to 10 from 20. When we ran the test the results are plain sailing. No request failures and no out of memory errors. However the request times are not that great. Min is 2.2 sec as expected but the max is 16 sec and the avg is 7.7 sec.
Generate Summary Results = 100 in 00:02:10 = 0.8/s Avg: 7790 Min: 2292 Max: 16314 Err: 0 (0.00%)
But we do see a pattern in the result. amount of memory we allocate should be good enough to hold all the object to hold the memory and not cause failures in request but otherwise amount of cpu is responsible for quick processing (unless GC throws spanner in our works ). so following proportion holds
No of clients -> More memory Processing time -> More CPU
Good lets run the test for long increasing no of loops from 10 to 100 and decrease no of client to 5. If our assumption is right then avg and the max time should come down even though our total no of requests are 5 times larger.After running the tests the results are inline with our assumptions even thought they are not that great. Average came down to 6 seconds and the max came down to 10 seconds from 18 seconds.
Generate Summary Results = 500 in 00:10:50 = 0.8/s Avg: 6060 Min: 2218 Max: 9902 Err: 0 (0.00%)
Scale up the instance to m7g.2xlarge and the test results are consistent. avg came down to 3.6 sec from 6
Generate Summary Results = 500 in 00:06:55 = 1.2/s Avg: 3688 Min: 2029 Max: 5306 Err: 0 (0.00%)
The same test suite on m6a.2xlarge yields following
Generate Summary Results = 500 in 00:07:22 = 1.1/s Avg: 3941 Min: 2098 Max: 5117 Err: 0 (0.00%)
There is a JVM parameter in jdk 12 and above that will allow to run periodic GC and return unused heap memory to host operating system. This help us return the memory and resolve earlier problem of Memory based scaling work. the parameter to set is -XX:G1PeriodicGCInterval in milli seconds. This will trigger the GC if previous gc is greater than specified time and return heap memory.
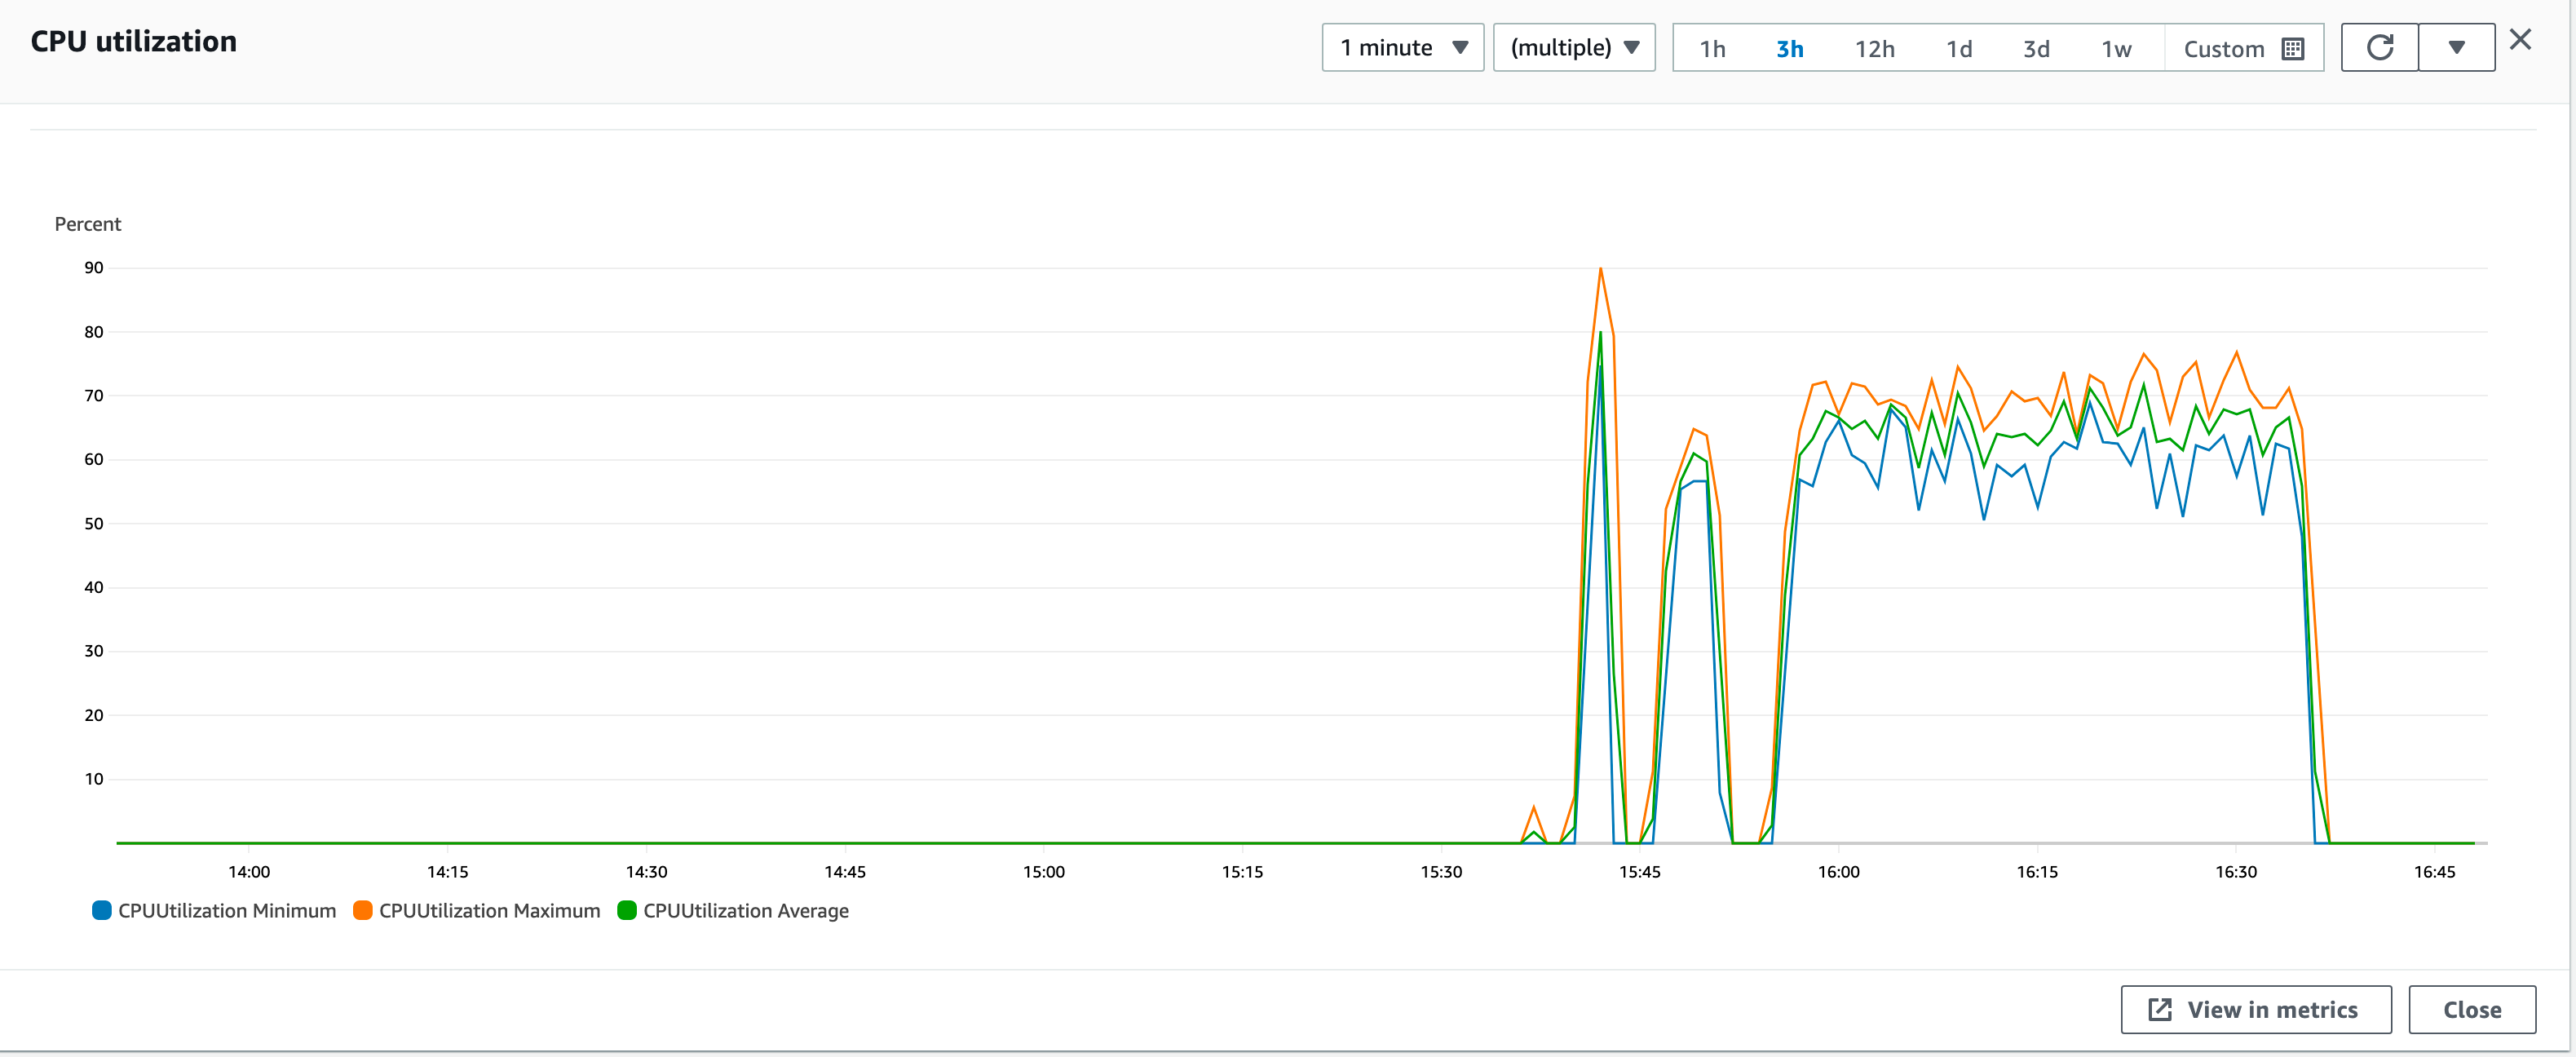
Now Lets test to conditions close to our production environment where each call retrieves 10,000 records per call and in fargate instance. with 25 clients concurrently making calls we get following results in intel fargate containers. Intel Container are maxed out in terms of CPU utilization.
Generate Summary Results = 25000 in 00:42:38 = 9.8/s Avg: 2379 Min: 625 Max: 6124 Err: 0 (0.00%)
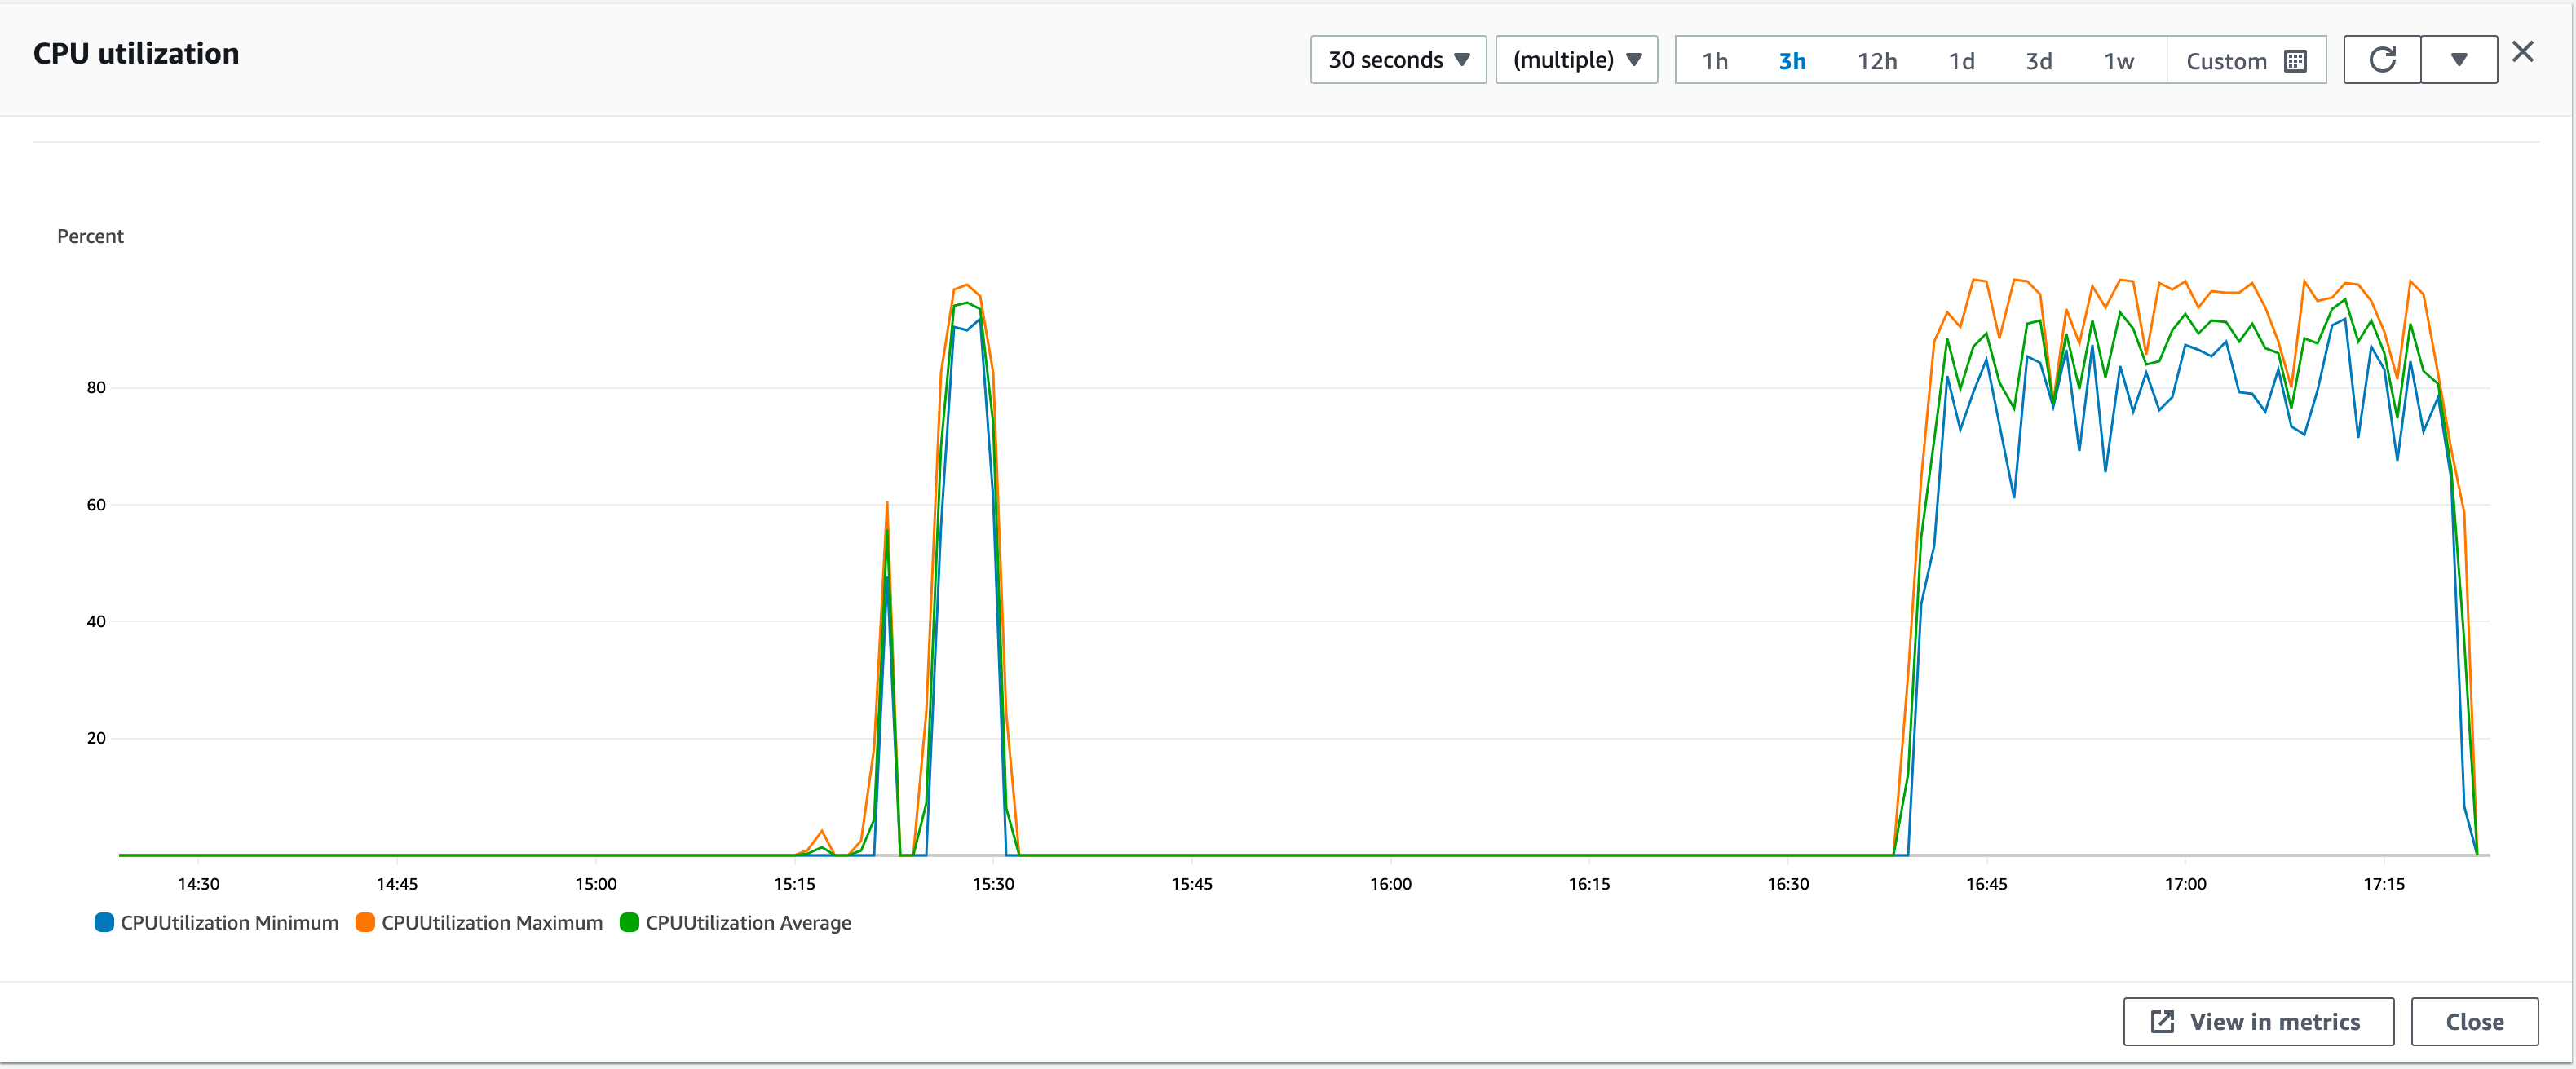
And the same requests with arm based fargate containers with CPU usage averaging around 70% The ability to serve the requests are limited by our database backend.
Generate Summary Results = 25000 in 00:40:46 = 10.2/s Avg: 2270 Min: 672 Max: 5404 Err: 0 (0.00%)
Considering that arm containers are 20% cheaper and around 10 more performant in terms of request throughput with more head room in cpu switching to ARM containers for our API workload will be a no-brainer with significant price/performance advantage. unless you are using FARGATE spot provider which is not available in ARM containers and cheaper about 70%. But again that is a discussion for another day.